Data in this graph are copyrighted. Please review the copyright information in the series notes before sharing.
NOTES
Source: U.S. Bureau of Economic Analysis
Release: Gross Domestic Product
Units: Billions of Dollars, Seasonally Adjusted Annual Rate
Frequency: Quarterly
Notes:
BEA Account Code: A455RC1
For more information about this series, please see http://www.bea.gov/national/.
Suggested Citation:
U.S. Bureau of Economic Analysis, Gross value added of nonfinancial corporate business [A455RC1Q027SBEA], retrieved from ALFRED, Federal Reserve Bank of St. Louis; https://alfred.stlouisfed.org/series?seid=A455RC1Q027SBEA, May 5, 2024.
Source: U.S. Bureau of Economic Analysis
Release: Gross Domestic Product
Units: Index 2009=100, Seasonally Adjusted
Frequency: Quarterly
Notes:
BEA Account Code: A191RD3
The number of decimal places reported varies over time. A Guide to the National Income and Product Accounts of the United States (NIPA) - (http://www.bea.gov/national/pdf/nipaguid.pdf)
Suggested Citation:
U.S. Bureau of Economic Analysis, Gross Domestic Product: Implicit Price Deflator [GDPDEF], retrieved from ALFRED, Federal Reserve Bank of St. Louis; https://alfred.stlouisfed.org/series?seid=GDPDEF, May 5, 2024.
Source: Federal Reserve Bank of St. Louis
Release: St. Louis Fed Financial Stress Index
Units: Index, Not Seasonally Adjusted
Frequency: Weekly, Ending Friday
Notes:
The STLFSI measures the degree of financial stress in the markets and is constructed from 18 weekly data series: seven interest rate series, six yield spreads and five other indicators. Each of these variables captures some aspect of financial stress. Accordingly, as the level of financial stress in the economy changes, the data series are likely to move together. The latest STLFSI press release, with commentary, can be found at https://www.stlouisfed.org/news-releases
How to Interpret the Index
The average value of the index, which begins in late 1993, is designed to be zero. Thus, zero is viewed as representing normal financial market conditions. Values below zero suggest below-average financial market stress, while values above zero suggest above-average financial market stress.
More information
For additional information on the STLFSI and its construction, see “Measuring Financial Market Stress” (http://research.stlouisfed.org/publications/es/10/ES1002.pdf) and the related appendix (https://files.stlouisfed.org/files/htdocs/publications/net/NETJan2010Appendix.pdf). As of 07/15/2010 the Vanguard Financial Exchange-Traded Fund series has been replaced with the S&P 500 Financials Index. This change was made to facilitate a more timely and automated updating of the FSI. Switching from the Vanguard series to the S&P series produced no meaningful change in the index.
Copyright, 2016, Federal Reserve Bank of St. Louis.
Suggested Citation:
Federal Reserve Bank of St. Louis, St. Louis Fed Financial Stress Index [STLFSI], retrieved from ALFRED, Federal Reserve Bank of St. Louis; https://alfred.stlouisfed.org/series?seid=STLFSI, May 5, 2024.
Source: Chicago Board Options Exchange
Release: CBOE Market Statistics
Units: Index, Not Seasonally Adjusted
Frequency: Daily, Close
Notes:
VIX measures market expectation of near term volatility conveyed by stock index option prices. Copyright, 2016, Chicago Board Options Exchange, Inc. Reprinted with permission.
Suggested Citation:
Chicago Board Options Exchange, CBOE Volatility Index: VIX [VIXCLS], retrieved from ALFRED, Federal Reserve Bank of St. Louis; https://alfred.stlouisfed.org/series?seid=VIXCLS, May 5, 2024.
Source: Board of Governors of the Federal Reserve System (US)
Release: Federal Reserve Board of Governors Labor Market Conditions Index
Units: Index Points, Seasonally Adjusted
Frequency: Monthly
Notes:
The LMCI is derived from a dynamic factor model that extracts the primary common variation from 19, seasonally-adjusted, labor market indicators. Users can read about the included indicators at http://www.federalreserve.gov/econresdata/notes/feds-notes/2014/updating-the-labor-market-conditions-index-20141001.html.
Users of the LMCI should take note that the entire history of the LMCI may revise each month. Three sources contribute to such revisions. The first source is new data that were not available at the time of the employment report. In particular, at the time of the Employment Situation report each month, the quit rate and hiring rate will be missing for the last two months of the sample because the Job Openings and Labor Turnover Survey is published with a longer lag than the model's other indicators. In subsequent months, as these data become available, the LMCI will revise.
The second source of revision comes from revisions to existing data. Many labor market indicators are subject to revision as additional source data become available or to incorporate annual benchmark revisions or updated seasonal adjustment factors. Prominent examples in the LMCI include the three payroll employment series from the Current Employment Statistics program.
The third source of revision is inherent to the model. The LMCI is derived from the Kalman smoother, meaning that the estimate of the index in any particular month is the model's best assessment given all past and future observations. Thus, when a new month of data is added to the sample, the model will revise its estimate of history in response to the new information. In practice, these revisions tend to be modest and concentrated in the most-recent six months of the sample.
Suggested Citation:
Board of Governors of the Federal Reserve System (US), Change in Labor Market Conditions Index [FRBLMCI], retrieved from ALFRED, Federal Reserve Bank of St. Louis; https://alfred.stlouisfed.org/series?seid=FRBLMCI, May 5, 2024.
Source: Board of Governors of the Federal Reserve System (US)
Release: Z.1 Financial Accounts of the United States
Units: Millions of Dollars, Not Seasonally Adjusted
Frequency: Quarterly
Notes:
The source ID is FL103164103.Q
This data appear in Table S.5.q of the 'Integrated Macroeconomic Accounts for the United States.'
These tables present a sequence of accounts that relate production, income and spending, capital formation, financial transactions, and asset revaluations to changes in net worth between balance sheets for the major sectors of the U.S. economy. They are part of an interagency effort to further harmonize the BEA National Income and Product Accounts (NIPAs) and the Federal Reserve Board Flow of Funds Accounts (FFAs). The structure of these tables is based on the internationally accepted set of guidelines for the compilation of national accounts that are offered in the System of National Accounts 1993 (SNA).
Cautionary note on the use of the integrated macroeconomic accounts (IMA) - The estimates that are provided on this page are based on a unique set of accounting standards that are founded on the SNA. Accordingly, some of the estimates in in the IMA tables will differ from the official estimates that are published in the NIPAs and FFAs due to conceptual differences. There will also be some statistical differences between the estimates in these tables and those in the related accounts. For further information on the conceptual differences, see the paper at https://www.bea.gov/data/special-topics/integrated-macroeconomic-accounts.
Suggested Citation:
Board of Governors of the Federal Reserve System (US), Nonfinancial corporate business; corporate equities; liability, Level [NCBEILQ027S], retrieved from ALFRED, Federal Reserve Bank of St. Louis; https://alfred.stlouisfed.org/series?seid=NCBEILQ027S, May 5, 2024.
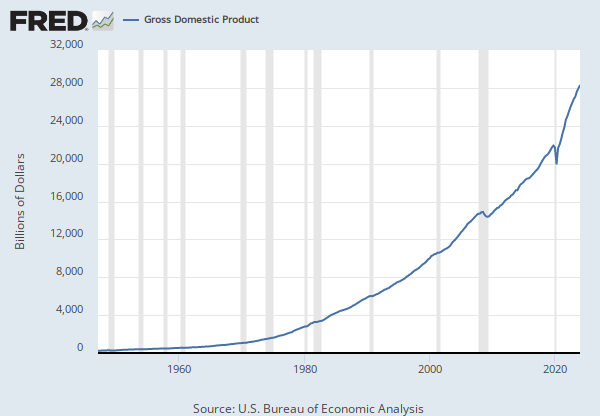
Source: U.S. Bureau of Economic Analysis
Release: Gross Domestic Product
Units: Billions of Dollars, Seasonally Adjusted Annual Rate
Frequency: Quarterly
Notes:
BEA Account Code: A191RC1
Gross domestic product (GDP), the featured measure of U.S. output, is the market value of the goods and services produced by labor and property located in the United States.
For more information, see the Guide to the National Income and Product Accounts of the United States (NIPA) - (http://www.bea.gov/national/pdf/nipaguid.pdf)
Suggested Citation:
U.S. Bureau of Economic Analysis, Gross Domestic Product [GDP], retrieved from ALFRED, Federal Reserve Bank of St. Louis; https://alfred.stlouisfed.org/series?seid=GDP, May 5, 2024.
Source: Board of Governors of the Federal Reserve System (US)
Release: H.10 Foreign Exchange Rates
Units: Japanese Yen to One U.S. Dollar, Not Seasonally Adjusted
Frequency: Daily
Notes:
Noon buying rates in New York City for cable transfers payable in foreign currencies.
Suggested Citation:
Board of Governors of the Federal Reserve System (US), Japanese Yen to U.S. Dollar Spot Exchange Rate [DEXJPUS], retrieved from ALFRED, Federal Reserve Bank of St. Louis; https://alfred.stlouisfed.org/series?seid=DEXJPUS, May 5, 2024.
Source: Board of Governors of the Federal Reserve System (US)
Release: Senior Loan Officer Opinion Survey on Bank Lending Practices
Units: Percent, Not Seasonally Adjusted
Frequency: Quarterly
Notes:
For further information, please refer to the Board of Governors of the Federal Reserve System's Senior Loan Officer Opinion Survey on Bank Lending Practices release, online at http://www.federalreserve.gov/boarddocs/SnLoanSurvey/.
Suggested Citation:
Board of Governors of the Federal Reserve System (US), Net Percentage of Domestic Banks Tightening Standards for Commercial and Industrial Loans to Large and Middle-Market Firms [DRTSCILM], retrieved from ALFRED, Federal Reserve Bank of St. Louis; https://alfred.stlouisfed.org/series?seid=DRTSCILM, May 5, 2024.
RELEASE TABLES
- Table 1.1.5. Gross Domestic Product: Quarterly
- Table 1.1.9. Implicit Price Deflators for Gross Domestic Product: Quarterly
- Table 1.2.5. Gross Domestic Product by Major Type of Product: Quarterly
- Table 1.3.5. Gross Value Added by Sector: Quarterly
- Table 1.4.5. Relation of Gross Domestic Product, Gross Domestic Purchases, and Final Sales to Domestic Purchasers: Quarterly
- Table 1.5.5. Gross Domestic Product, Expanded Detail: Quarterly
- Table 1.7.5. Relation of Gross Domestic Product, Gross National Product, Net National Product, National Income, and Personal Income: Quarterly
- Table 1.14. Gross Value Added of Domestic Corporate Business in Current Dollars and Gross Value Added of Nonfinancial Domestic Corporate Business in Current and Chained Dollars: Quarterly
- Table 1.17.5. Gross Domestic Product, Gross Domestic Income, and Other Major NIPA Aggregates: Quarterly
RELATED DATA AND CONTENT
Data Suggestions Based On Your Search
Content Suggestions
Other Formats
Gross value added of nonfinancial corporate business
Annual, Not Seasonally AdjustedGross Domestic Product: Implicit Price Deflator
Percent Change from Preceding Period, Annual, Not Seasonally Adjusted Percent Change from Preceding Period, Quarterly, Seasonally Adjusted Annual RateNonfinancial corporate business; corporate equities; liability, Level
Annual, Not Seasonally AdjustedGross Domestic Product
Annual, Not Seasonally Adjusted Annual, Not Seasonally Adjusted Percent Change from Preceding Period, Annual, Not Seasonally Adjusted Percent Change from Preceding Period, Quarterly, Seasonally Adjusted Annual RateJapanese Yen to U.S. Dollar Spot Exchange Rate
Annual, Not Seasonally Adjusted Monthly, Not Seasonally Adjusted


