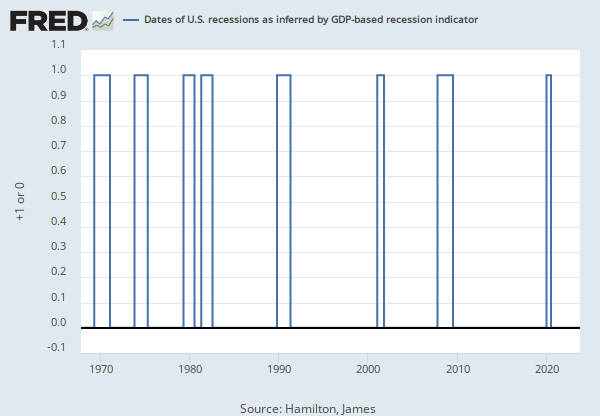
Observations
Feb 2020: 1.72 | Percent, Seasonally Adjusted | Monthly
Updated: Apr 14, 2020 9:16 AM CDT
Observations
Feb 2020:
1.72
Updated:
Apr 14, 2020
9:16 AM CDT
| Feb 2020: | 1.72 | |
| Jan 2020: | 1.57 | |
| Dec 2019: | 1.48 | |
| Nov 2019: | 1.38 | |
| Oct 2019: | 1.41 |
Units:
Percent,
Seasonally Adjusted
Frequency:
Monthly
Data in this graph are copyrighted. Please review the copyright information in the series notes before sharing.
Notes
| Title | Release Dates | |
|
|
||
| Leading Index for the United States | 2011-02-01 | 2020-04-14 |
| Source | ||
|
|
||
| Federal Reserve Bank of Philadelphia | 2011-02-01 | 2020-04-14 |
| Release | ||
|
|
||
| State Leading Indexes | 2011-02-01 | 2020-04-14 |
| Units | ||
|
|
||
| Percent | 2011-02-01 | 2020-04-14 |
| Frequency | ||
|
|
||
| Monthly | 2011-02-01 | 2020-04-14 |
| Seasonal Adjustment | ||
|
|
||
| Seasonally Adjusted | 2011-02-01 | 2020-04-14 |
| Notes | ||
|
|
||
|
The leading index for each state predicts the six-month growth rate of the state's coincident index. In addition to the coincident index, the models include other variables that lead the economy: state-level housing permits (1 to 4 units), state initial unemployment insurance claims, delivery times from the Institute for Supply Management (ISM) manufacturing survey, and the interest rate spread between the 10-year Treasury bond and the 3-month Treasury bill.
|
2011-02-01 | 2020-04-14 |
Release Tables
State Leading Indexes
Related Data and Content
Data Suggestions Based On Your Search
Content Suggestions
Related Categories
Business Cycle Expansions & Contractions
Production & Business Activity
Financial Activity Measures
Financial Indicators
Money, Banking, & Finance
Releases
Tags
Permalink/Embed
modal open, choose link customization options
Select automatic updates to the data or a static time frame. All data are subject to revision.


