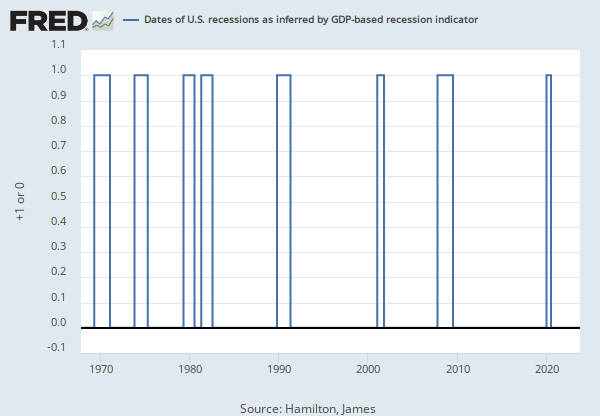
1Y |
5Y |
10Y |
Max
Home > Releases > U.S. Recession Probabilities > Smoothed U.S. Recession Probabilities
Observation:
Dec 2022: 4.96 (+ more)Dec 2022: | 4.96 | |
Nov 2022: | 3.86 | |
Oct 2022: | 1.48 | |
Sep 2022: | 0.28 | |
Aug 2022: | 0.12 |
Units:
Percent,Frequency:
MonthlyData in this graph are copyrighted. Please review the copyright information in the series notes before sharing.
Title | Release Dates | |
|
||
Smoothed U.S. Recession Probabilities | 2012-09-04 | 2023-02-01 |
Source | ||
|
||
Chauvet, Marcelle | 2012-09-04 | 2019-06-30 |
Piger, Jeremy Max | 2012-09-04 | 2019-06-30 |
Chauvet, Marcelle | 2019-07-01 | 2023-02-01 |
Piger, Jeremy Max | 2019-07-01 | 2023-02-01 |
Release | ||
|
||
U.S. Recession Probabilities | 2012-09-04 | 2023-02-01 |
Units | ||
|
||
Percent | 2012-09-04 | 2023-02-01 |
Frequency | ||
|
||
Monthly | 2012-09-04 | 2023-02-01 |
Seasonal Adjustment | ||
|
||
Not Seasonally Adjusted | 2012-09-04 | 2023-02-01 |
Notes | ||
|
||
Smoothed recession probabilities for the United States are obtained from a dynamic-factor markov-switching model applied to four monthly coincident variables: non-farm payroll employment, the index of industrial production, real personal income excluding transfer payments, and real manufacturing and trade sales. This model was originally developed in Chauvet, M., "An Economic Characterization of Business Cycle Dynamics with Factor Structure and Regime Switching," International Economic Review, 1998, 39, 969-996. (http://faculty.ucr.edu/~chauvet/ier.pdf) For additional details, including an analysis of the performance of this model for dating business cycles in real time, see: Chauvet, M. and J. Piger, “A Comparison of the Real-Time Performance of Business Cycle Dating Methods,” Journal of Business and Economic Statistics, 2008, 26, 42-49. (http://pages.uoregon.edu/jpiger/research/published-papers/chauvet-and-piger_2008_jour.pdf) For additional details as to why this data revises, see FAQ 3 at http://pages.uoregon.edu/jpiger/us_recession_probs.htm. |
2012-09-04 | 2019-06-30 |
Smoothed recession probabilities for the United States are obtained from a dynamic-factor markov-switching model applied to four monthly coincident variables: non-farm payroll employment, the index of industrial production, real personal income excluding transfer payments, and real manufacturing and trade sales. This model was originally developed in Chauvet, M., "An Economic Characterization of Business Cycle Dynamics with Factor Structure and Regime Switching," International Economic Review, 1998, 39, 969-996. For additional details, including an analysis of the performance of this model for dating business cycles in real time, see: Chauvet, M. and J. Piger, "A" class="breakable" target="_blank" rel="nofollow">http://pages.uoregon.edu/jpiger/research/published-papers/chauvet-and-piger_2008_jour.pdf">A Comparison of the Real-Time Performance of Business Cycle Dating Methods (https://pdfs.semanticscholar.org/f2ed/8fac87c0c82c3d85ca64ee9846658d8810fb.pdf?_ga=2.168797348.404457612.1561570817-1723670870.1561570817)," Journal of Business and Economic Statistics, 2008, 26, 42-49. For additional details as to why this data revises, see FAQ 3 (http://pages.uoregon.edu/jpiger/us_recession_probs.htm). |
2019-07-01 | 2023-02-01 |
Are you sure you want to remove this series from the graph? This can not be undone.