Notes
| Title | Release Dates | |
|
|
||
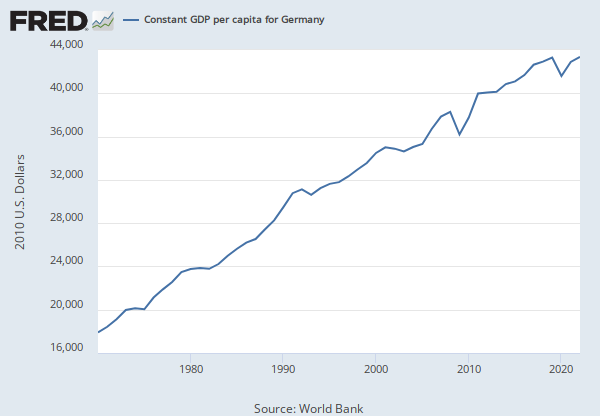
| Gross Domestic Product for Germany | 2012-09-24 | 2024-12-17 |
| Source | ||
|
|
||
| World Bank | 2012-09-24 | 2024-12-17 |
| Release | ||
|
|
||
| Global Financial Development | 2012-09-24 | 2015-12-21 |
| World Development Indicators | 2015-12-22 | 2024-12-17 |
| Units | ||
|
|
||
| Current Dollars | 2012-09-24 | 2015-12-21 |
| Current U.S. Dollars | 2015-12-22 | 2024-12-17 |
| Frequency | ||
|
|
||
| Annual | 2012-09-24 | 2024-12-17 |
| Seasonal Adjustment | ||
|
|
||
| Not Seasonally Adjusted | 2012-09-24 | 2024-12-17 |
| Notes | ||
|
|
||
|
GDP at purchaser's prices is the sum of gross value added by all resident producers in the economy plus any product taxes and minus any subsidies not included in the value of the products. It is calculated without making deductions for depreciation of fabricated assets or for depletion and degradation of natural resources. Data are in current U.S. dollars. Dollar figures for GDP are converted from domestic currencies using single year official exchange rates. For a few countries where the official exchange rate does not reflect the rate effectively applied to actual foreign exchange transactions, an alternative conversion factor is used. Source Code: NY.GDP.MKTP.CD |
2012-09-24 | 2024-12-17 |
Related Data and Content
Data Suggestions Based On Your Search


Content Suggestions


Other Formats
Millions of Euros, Quarterly, Not Seasonally Adjusted
Millions of Euros, Quarterly, Seasonally Adjusted