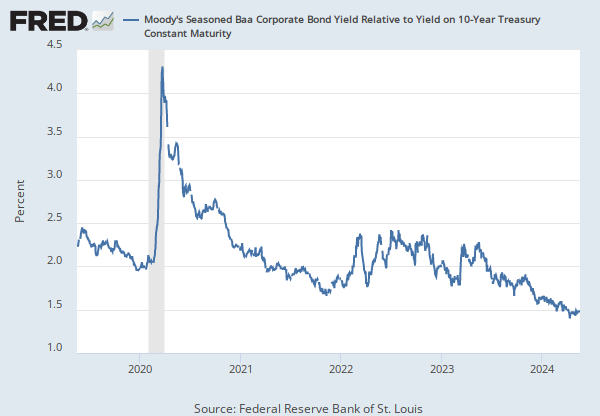
Home > Releases > Interest Rate Spreads > TED Spread (DISCONTINUED)

TED Spread (DISCONTINUED) (TEDRATE)

2022-01-21: 0.09
Updated: Jan 28, 2022 4:01 PM CST
2022-01-21:  0.09  
2022-01-20:  0.08  
2022-01-19:  0.09  
2022-01-18:  0.08  
2022-01-17:  .  

Units:

Percent,
Not Seasonally Adjusted

Frequency:

Daily
1Y5Y10YMax
to
Date:
Bar 1 - TED Spread Vintage: 2022-01-27
Bar 1
(a) TED Spread, Percent, Not Seasonally Adjusted (TEDRATE)
Series is calculated as the spread between 3-Month LIBOR based on US dollars (https://fred.stlouisfed.org/series/USD3MTD156N) and 3-Month Treasury Bill (https://fred.stlouisfed.org/series/DTB3). The series is lagged by one week because the LIBOR series is lagged by one week due to an agreement with the source. Starting with the update on June 21, 2019, the Treasury bond data used in calculating interest rate spreads is obtained directly from the U.S. Treasury Department (https://www.treasury.gov/resource-center/data-chart-center/interest-rates/Pages/TextView.aspx?data=yield).

Select a date that will equal 100 for your custom index:
  Enter date as YYYY-MM-DD
to

Write a custom formula to transform one or more series or combine two or more series.

You can begin by adding a series to combine with your existing series.

Type keywords to search for data

    Now create a custom formula to combine or transform the series.

    For example, invert an exchange rate by using formula 1/a, where “a” refers to the first FRED data series added to this line. Or calculate the spread between 2 interest rates, a and b, by using the formula a - b.

    Use the assigned data series variables (a, b, c, etc.) together with operators (+, -, *, /, ^, etc.), parentheses and constants (1, 1.5, 2, etc.) to create your own formula (e.g., 1/a, a-b, (a+b)/2, (a/(a+b+c))*100). As noted above, you may add other data series to this line before entering a formula.

    Finally, you can change the units of your new series.

    Select a date that will equal 100 for your custom index:
        Enter date as YYYY-MM-DD

    Bar 1 - TED Spread Vintage: 2022-01-27
    Bar 2
    (a) TED Spread (DISCONTINUED), Percent, Not Seasonally Adjusted (TEDRATE)
    Series is calculated as the spread between 3-Month LIBOR based on US dollars (USD3MTD156N) and 3-Month Treasury Bill (DTB3 (https://fred.stlouisfed.org/series/DTB3)). Starting with the update on June 21, 2019, the Treasury bond data used in calculating interest rate spreads is obtained directly from the U.S. Treasury Department (https://www.treasury.gov/resource-center/data-chart-center/interest-rates/Pages/TextView.aspx?data=yield). The 3-Month LIBOR based on US Dollars has been removed from FRED (https://news.research.stlouisfed.org/2022/01/ice-benchmark-administration-ltd-iba-data-to-be-removed-from-fred/) as of January 31, 2022, so this calculated series has been discontinued and will no longer be updated. Users interested in calculating a similar credit risk can use the Secured Overnight Financing Rate (SOFR), which has been identified as the rate that represents best practice for use in certain new U.S. Dollar derivatives and other financial contracts. For more details, see the article Transition from LIBOR (https://www.newyorkfed.org/arrc/sofr-transition) from the Alternative Reference Rates Committee (AARC).

    Select a date that will equal 100 for your custom index:
      Enter date as YYYY-MM-DD
    to

    Write a custom formula to transform one or more series or combine two or more series.

    You can begin by adding a series to combine with your existing series.

    Type keywords to search for data

      Now create a custom formula to combine or transform the series.

      For example, invert an exchange rate by using formula 1/a, where “a” refers to the first FRED data series added to this line. Or calculate the spread between 2 interest rates, a and b, by using the formula a - b.

      Use the assigned data series variables (a, b, c, etc.) together with operators (+, -, *, /, ^, etc.), parentheses and constants (1, 1.5, 2, etc.) to create your own formula (e.g., 1/a, a-b, (a+b)/2, (a/(a+b+c))*100). As noted above, you may add other data series to this line before entering a formula.

      Finally, you can change the units of your new series.

      Select a date that will equal 100 for your custom index:
          Enter date as YYYY-MM-DD

      ADDLINE
      Type keywords to search for data
      Create user-defined line
      You can customize a graph by adding a straight line between two data points.
      FORMAT GRAPH
      Details
      Display
      Customize
      Frame
      Plot area
      Text

      Bar 1
      TED Spread Vintage: 2022-01-27
      Line details & color

      Line style, thickness, color and position


      Bar 2
      TED Spread (DISCONTINUED) Vintage: 2022-01-28
      Line details & color

      Line style, thickness, color and position


      Fullscreen

      Notes

      Title Release Dates

      2014-01-27 2022-01-27
      2022-01-28 2022-01-28
       
      Source    

      2014-01-27 2022-01-28
       
      Release    

      2014-01-27 2022-01-28
       
      Units    

      2014-01-27 2022-01-28
       
      Frequency    

      2014-01-27 2022-01-28
       
      Seasonal Adjustment    

      2014-01-27 2022-01-28
       
      Notes    

      2014-01-27 2019-06-20
      2019-06-21 2022-01-27
      2022-01-28 2022-01-28

      Release Tables


      Color format