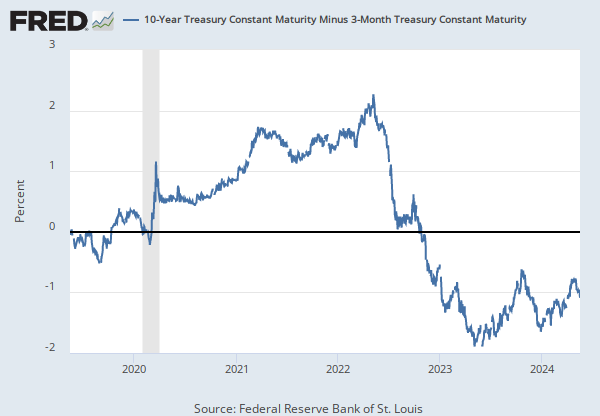
1Y |
5Y |
10Y |
Max
Home > Releases > Sahm Rule Recession Indicator > Real-time Sahm Rule Recession Indicator
Observation:
Jul 2022: -0.03 (+ more)Jul 2022: | -0.03 | |
Jun 2022: | 0.00 | |
May 2022: | -0.07 | |
Apr 2022: | -0.13 | |
Mar 2022: | -0.10 |
Units:
Percentage Points,Frequency:
MonthlyData in this graph are copyrighted. Please review the copyright information in the series notes before sharing.
Title | Release Dates | |
|
||
Real-time Sahm Rule Recession Indicator | 2019-09-06 | 2022-08-05 |
Source | ||
|
||
Sahm, Claudia | 2019-09-06 | 2022-08-05 |
Release | ||
|
||
Sahm Rule Recession Indicator | 2019-09-06 | 2022-08-05 |
Units | ||
|
||
Percentage Points | 2019-09-06 | 2022-08-05 |
Frequency | ||
|
||
Monthly | 2019-09-06 | 2022-08-05 |
Seasonal Adjustment | ||
|
||
Seasonally Adjusted | 2019-09-06 | 2022-08-05 |
Notes | ||
|
||
Sahm Recession Indicator signals the start of a recession when the three-month moving average of the national unemployment rate (U3) (https://fred.stlouisfed.org/series/UNRATE) rises by 0.50 percentage points or more relative to its low during the previous 12 months.
This indicator is based on "real-time" data, that is, the unemployment rate (and the recent history of unemployment rates) that were available in a given month. The BLS revises the unemployment rate each year at the beginning of January, when the December unemployment rate for the prior year is published. Revisions to the seasonal factors can affect estimates in recent years. Otherwise the unemployment rate does not revise. |
2019-09-06 | 2022-08-05 |
Are you sure you want to remove this series from the graph? This can not be undone.