Observations
2022: 16,068,662,000,000.00000 | Euro, Not Seasonally Adjusted | Annual
Updated: Dec 12, 2023 3:06 PM CST
Observations
2022:
16,068,662,000,000.00000
Updated:
Dec 12, 2023
3:06 PM CST
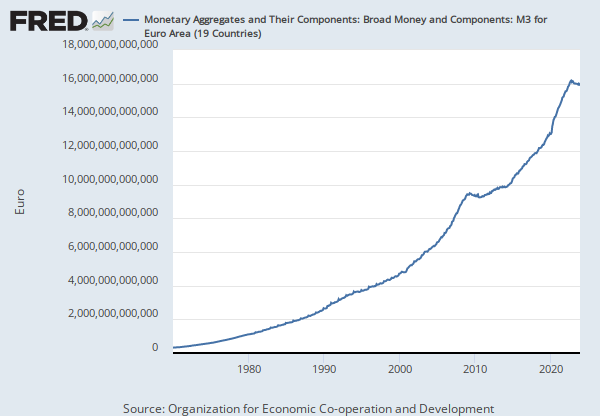
| 2022: | 16,068,662,000,000.00000 | |
| 2021: | 15,507,427,000,000.00000 | |
| 2020: | 14,483,234,000,000.00000 | |
| 2019: | 12,987,389,000,000.00000 | |
| 2018: | 12,371,400,000,000.00000 |
Units:
Euro,
Not Seasonally Adjusted
Frequency:
Annual
Fullscreen