1Y |
5Y |
10Y |
Max
Home > Releases > Federal Funds Data > Effective Federal Funds Volume
Observation:
2021-01-14: 64 (+ more)2021-01-14: | 64 | |
2021-01-13: | 64 | |
2021-01-12: | 61 | |
2021-01-11: | 55 | |
2021-01-08: | 55 |
Units:
Billions of U.S. Dollars,Frequency:
DailyData in this graph are copyrighted. Please review the copyright information in the series notes before sharing.
Title | Release Dates | |
|
||
Effective Federal Funds Volume | 2016-03-02 | 2021-01-15 |
Source | ||
|
||
Federal Reserve Bank of New York | 2016-03-02 | 2021-01-15 |
Release | ||
|
||
Federal Funds Data | 2016-03-02 | 2021-01-15 |
Units | ||
|
||
Billions of U.S. Dollars | 2016-03-02 | 2021-01-15 |
Frequency | ||
|
||
Daily | 2016-03-02 | 2021-01-15 |
Seasonal Adjustment | ||
|
||
Not Seasonally Adjusted | 2016-03-02 | 2021-01-15 |
Notes | ||
|
||
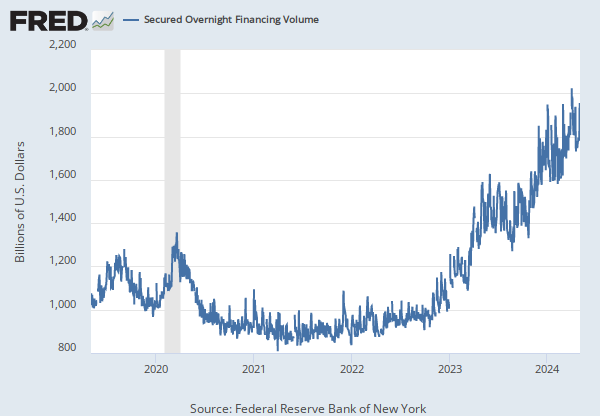
The federal funds market consists of domestic unsecured borrowings in U.S. dollars by depository institutions from other depository institutions and certain other entities, primarily government-sponsored enterprises. The effective federal funds rate (EFFR) is calculated as a volume-weighted median of overnight federal funds transactions reported in the FR 2420 Report of Selected Money Market Rates. For more information, see https://www.newyorkfed.org/markets/obfrinfo |
2016-03-02 | 2021-01-15 |
Are you sure you want to remove this series from the graph? This can not be undone.