1Y |
5Y |
10Y |
Max
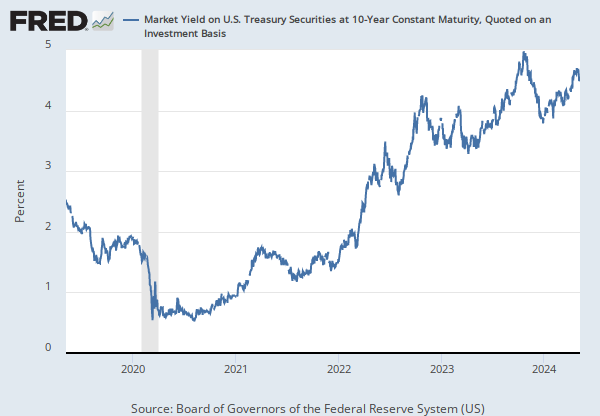
Home > Releases > H.15 Selected Interest Rates > 10-Year Treasury Constant Maturity Rate
Observation:
2021-01-08: 1.03 (+ more)2021-01-08: | 1.03 | |
2021-01-01: | 0.94 | |
2020-12-25: | 0.95 | |
2020-12-18: | 0.93 | |
2020-12-11: | 0.93 |
Units:
Percent,Frequency:
Weekly,Data in this graph are copyrighted. Please review the copyright information in the series notes before sharing.
Title | Release Dates | |
|
||
10-Year Treasury Constant Maturity Rate | 1996-12-09 | 2021-01-11 |
Source | ||
|
||
Board of Governors of the Federal Reserve System (US) | 1996-12-09 | 2021-01-11 |
Release | ||
|
||
H.15 Selected Interest Rates | 1996-12-09 | 2021-01-11 |
Units | ||
|
||
Percent | 1996-12-09 | 2021-01-11 |
Frequency | ||
|
||
Weekly, Ending Friday | 1996-12-09 | 2021-01-11 |
Seasonal Adjustment | ||
|
||
Not Seasonally Adjusted | 1996-12-09 | 2021-01-11 |
Notes | ||
|
||
Averages of business days. For further information regarding treasury constant maturity data, please refer to http://www.federalreserve.gov/releases/h15/current/h15.pdf and http://www.treasury.gov/resource-center/data-chart-center/interest-rates/Pages/yieldmethod.aspx.
|
1996-12-09 | 2019-06-30 |
Averages of business days. For further information regarding treasury constant maturity data, please refer to the Board of Governors (http://www.federalreserve.gov/releases/h15/current/h15.pdf) and the Treasury (http://www.treasury.gov/resource-center/data-chart-center/interest-rates/Pages/yieldmethod.aspx).
|
2019-07-01 | 2021-01-11 |
Are you sure you want to remove this series from the graph? This can not be undone.