|
Title
|
Release Dates
|
|
|
M2 Money Stock
|
1996-12-12
|
2021-02-22
|
|
M2 (DISCONTINUED)
|
2021-02-23
|
2026-02-24
|
|
|
|
Source
|
|
|
|
|
Board of Governors of the Federal Reserve System (US)
|
1996-12-12
|
2026-02-24
|
|
|
|
Release
|
|
|
|
|
H.6 Money Stock, Liquid Assets, and Debt Measures
|
1996-12-12
|
1998-12-09
|
|
H.6 Money Stock and Debt Measures
|
1998-12-10
|
2002-05-01
|
|
H.6 Money Stock Measures
|
2002-05-02
|
2026-02-24
|
|
|
|
Units
|
|
|
|
|
Billions of Dollars
|
1996-12-12
|
2026-02-24
|
|
|
|
Frequency
|
|
|
|
|
Weekly, Ending Monday
|
1996-12-12
|
2026-02-24
|
|
|
|
Seasonal Adjustment
|
|
|
|
|
Seasonally Adjusted
|
1996-12-12
|
2026-02-24
|
|
|
|
Notes
|
|
|
|
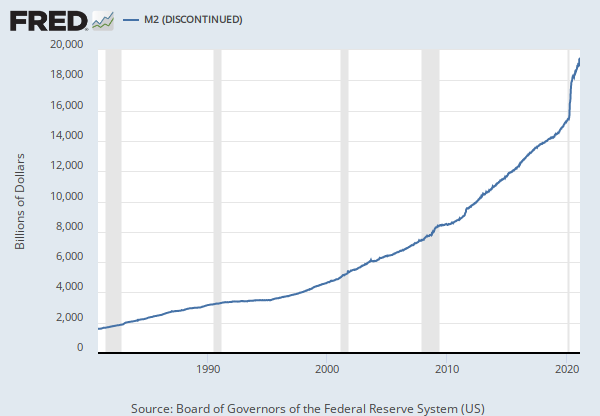
M2 includes a broader set of financial assets held principally by households. M2 consists of M1 plus: (1) savings deposits (which include money market deposit accounts, or MMDAs); (2) small-denomination time deposits (time deposits in amounts of less than $100,000); and (3) balances in retail money market mutual funds (MMMFs). Seasonally adjusted M2 is computed by summing savings deposits, small-denomination time deposits, and retail MMMFs, each seasonally adjusted separately, and adding this result to seasonally adjusted M1.
|
1996-12-12
|
2021-02-22
|
This weekly series is discontinued and will no longer be updated. The non-seasonally adjusted version of this weekly series is WM2NS (https://fred.stlouisfed.org/series/WM2NS), and the seasonally adjusted monthly series is M2SL (https://fred.stlouisfed.org/series/M2SL).
Starting on February 23, 2021, the H.6 statistical release is now published at a monthly frequency and contains only monthly average data needed to construct the monetary aggregates. Weekly average, non-seasonally adjusted data will continue to be made available, while weekly average, seasonally adjusted data will no longer be provided. For further information about the changes to the H.6 Statistical Release, see the announcements (https://www.federalreserve.gov/feeds/h6.html) provided by the source.
Before May 2020, M2 consists of M1 plus (1) savings deposits (including money market deposit accounts); (2) small-denomination time deposits (time deposits in amounts of less than $100,000) less individual retirement account (IRA) and Keogh balances at depository institutions; and (3) balances in retail money market funds (MMFs) less IRA and Keogh balances at MMFs.
Beginning May 2020, M2 consists of M1 plus (1) small-denomination time deposits (time deposits in amounts of less than $100,000) less IRA and Keogh balances at depository institutions; and (2) balances in retail MMFs less IRA and Keogh balances at MMFs. Seasonally adjusted M2 is constructed by summing savings deposits (before May 2020), small-denomination time deposits, and retail MMFs, each seasonally adjusted separately, and adding this result to seasonally adjusted M1. For more information on the H.6 release changes and the regulatory amendment that led to the creation of the other liquid deposits component and its inclusion in the M1 monetary aggregate, see the H.6 announcements (https://www.federalreserve.gov/feeds/h6.html) and Technical Q&As (https://www.federalreserve.gov/releases/h6/h6_technical_qa.htm) posted on December 17, 2020.
|
2021-02-23
|
2024-09-23
|
WM2NS (https://fred.stlouisfed.org/series/WM2NS), and the seasonally adjusted monthly series is M2SL (https://fred.stlouisfed.org/series/M2SL).
Starting on February 23, 2021, the H.6 statistical release is now published at a monthly frequency and contains only monthly average data needed to construct the monetary aggregates. Weekly average, non-seasonally adjusted data will continue to be made available, while weekly average, seasonally adjusted data will no longer be provided. For further information about the changes to the H.6 statistical release, see the announcements (https://www.federalreserve.gov/feeds/h6.html) provided by the source.
Before May 2020, M2 consists of M1 plus (1) savings deposits (including money market deposit accounts); (2) small-denomination time deposits (time deposits in amounts of less than $100,000) less individual retirement account (IRA) and Keogh balances at depository institutions; and (3) balances in retail money market funds (MMFs) less IRA and Keogh balances at MMFs.
Beginning May 2020, M2 consists of M1 plus (1) small-denomination time deposits (time deposits in amounts of less than $100,000) less IRA and Keogh balances at depository institutions; and (2) balances in retail MMFs less IRA and Keogh balances at MMFs. Seasonally adjusted M2 is constructed by summing savings deposits (before May 2020), small-denomination time deposits, and retail MMFs, each seasonally adjusted separately, and adding this result to seasonally adjusted M1. For more information on the H.6 release changes and the regulatory amendment that led to the creation of the other liquid deposits component and its inclusion in the M1 monetary aggregate, see the H.6 announcements (https://www.federalreserve.gov/feeds/h6.html) and Technical Q&As (https://www.federalreserve.gov/releases/h6/h6_technical_qa.htm) posted on December 17, 2020.
For questions on the data, please contact the data source (https://www.federalreserve.gov/apps/ContactUs/feedback.aspx?refurl=/releases/h6/%). For questions on FRED functionality, please contact us here (https://fred.stlouisfed.org/contactus/).
|
2024-09-24
|
2026-02-24
|