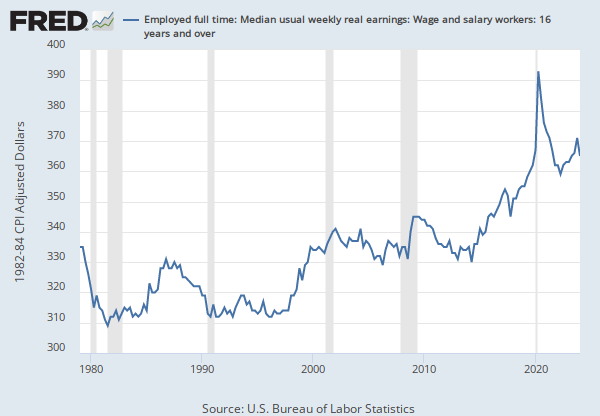
Data in this graph are copyrighted. Please review the copyright information in the series notes before sharing.
NOTES
| Title | Release Dates | |
|
|
||
| Employed: Percent of hourly paid workers: Paid total at or below prevailing federal minimum wage: Private wage and salary workers: Food services and drinking places industries: 16 years and over | 2015-01-21 | 2024-01-18 |
| Source | ||
|
|
||
| U.S. Bureau of Labor Statistics | 2015-01-21 | 2024-01-18 |
| Release | ||
|
|
||
| Weekly and Hourly Earnings from the Current Population Survey | 2015-01-21 | 2024-01-18 |
| Units | ||
|
|
||
| Percent | 2015-01-21 | 2024-01-18 |
| Frequency | ||
|
|
||
| Annual | 2015-01-21 | 2024-01-18 |
| Seasonal Adjustment | ||
|
|
||
| Not Seasonally Adjusted | 2015-01-21 | 2024-01-18 |
| Notes | ||
|
|
||
|
Data measure usual hourly earnings of wage and salary workers. Wage and salary workers are workers who receive wages, salaries, commissions, tips, payment in kind, or piece rates. The group includes employees in both the private and public sectors but, for the purposes of the earnings series, it excludes all self-employed persons, both those with incorporated businesses and those with unincorporated businesses. For more information see https://www.bls.gov/cps/earnings.htm The series comes from the 'Current Population Survey (Household Survey)' The source code is: LEU0206959300 |
2015-01-21 | 2024-01-18 |


