Observations
2026-06-13: 5,982,662 |
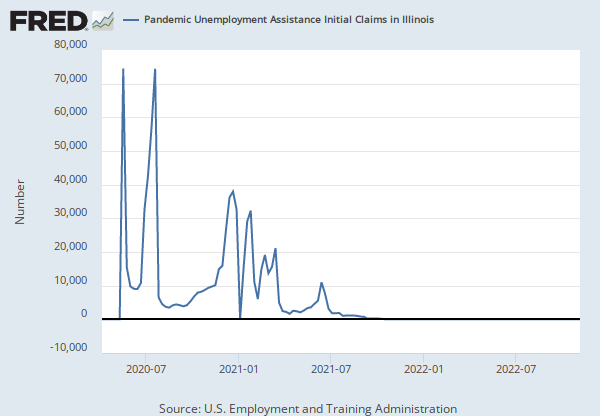
Number, Not Seasonally Adjusted |
Weekly,
Ending Saturday
Updated: Jun 26, 2026 7:39 AM CDT
Observations
2026-06-13:
5,982,662
Updated:
Jun 26, 2026
7:39 AM CDT
| 2026-06-13: | 5,982,662 | |
| 2026-06-06: | 5,982,662 | |
| 2026-05-30: | 5,982,662 | |
| 2026-05-23: | 5,982,662 | |
| 2026-05-16: | 5,982,662 |
Units:
Number,
Not Seasonally Adjusted
Frequency:
Weekly,
Ending Saturday
Fullscreen