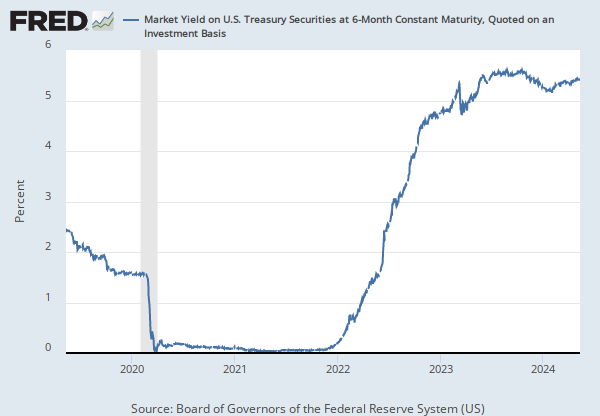
Home > Releases > H.15 Selected Interest Rates > Market Yield on U.S. Treasury Securities at 3-Year Constant Maturity, Quoted on an Investment Basis

Market Yield on U.S. Treasury Securities at 3-Year Constant Maturity, Quoted on an Investment Basis (DGS3)

2025-03-28: 3.91
Updated: Mar 31, 2025 3:17 PM CDT
2025-03-28:  3.91  
2025-03-27:  4.00  
2025-03-26:  4.01  
2025-03-25:  3.98  
2025-03-24:  4.01  

Units:

Percent,
Not Seasonally Adjusted

Frequency:

Daily
1Y5Y10YMax
to
Date:
Bar 1 - Market Yield on U.S. Treasury Securities at 3-Year Constant Maturity, Quoted on an Investment Basis Vintage: 2025-03-28
Bar 1
(a) Market Yield on U.S. Treasury Securities at 3-Year Constant Maturity, Quoted on an Investment Basis, Percent, Not Seasonally Adjusted (DGS3)
H.15 Statistical Release notes (https://www.federalreserve.gov/releases/h15/default.htm) and the Treasury Yield Curve Methodology (https://home.treasury.gov/policy-issues/financing-the-government/interest-rate-statistics/treasury-yield-curve-methodology). For questions on the data, please contact the data source (https://www.federalreserve.gov/apps/ContactUs/feedback.aspx?refurl=/releases/h15/%). For questions on FRED functionality, please contact us here (https://fred.stlouisfed.org/contactus/).</p>

Select a date that will equal 100 for your custom index:
  Enter date as YYYY-MM-DD
to

Write a custom formula to transform one or more series or combine two or more series.

You can begin by adding a series to combine with your existing series.

Type keywords to search for data

    Now create a custom formula to combine or transform the series.

    For example, invert an exchange rate by using formula 1/a, where “a” refers to the first FRED data series added to this line. Or calculate the spread between 2 interest rates, a and b, by using the formula a - b.

    Use the assigned data series variables (a, b, c, etc.) together with operators (+, -, *, /, ^, etc.), parentheses and constants (1, 1.5, 2, etc.) to create your own formula (e.g., 1/a, a-b, (a+b)/2, (a/(a+b+c))*100). As noted above, you may add other data series to this line before entering a formula.

    Finally, you can change the units of your new series.

    Select a date that will equal 100 for your custom index:
        Enter date as YYYY-MM-DD

    Bar 1 - Market Yield on U.S. Treasury Securities at 3-Year Constant Maturity, Quoted on an Investment Basis Vintage: 2025-03-28
    Bar 2
    (a) Market Yield on U.S. Treasury Securities at 3-Year Constant Maturity, Quoted on an Investment Basis, Percent, Not Seasonally Adjusted (DGS3)
    H.15 Statistical Release notes (https://www.federalreserve.gov/releases/h15/default.htm) and the Treasury Yield Curve Methodology (https://home.treasury.gov/policy-issues/financing-the-government/interest-rate-statistics/treasury-yield-curve-methodology). For questions on the data, please contact the data source (https://www.federalreserve.gov/apps/ContactUs/feedback.aspx?refurl=/releases/h15/%). For questions on FRED functionality, please contact us here (https://fred.stlouisfed.org/contactus/).</p>

    Select a date that will equal 100 for your custom index:
      Enter date as YYYY-MM-DD
    to

    Write a custom formula to transform one or more series or combine two or more series.

    You can begin by adding a series to combine with your existing series.

    Type keywords to search for data

      Now create a custom formula to combine or transform the series.

      For example, invert an exchange rate by using formula 1/a, where “a” refers to the first FRED data series added to this line. Or calculate the spread between 2 interest rates, a and b, by using the formula a - b.

      Use the assigned data series variables (a, b, c, etc.) together with operators (+, -, *, /, ^, etc.), parentheses and constants (1, 1.5, 2, etc.) to create your own formula (e.g., 1/a, a-b, (a+b)/2, (a/(a+b+c))*100). As noted above, you may add other data series to this line before entering a formula.

      Finally, you can change the units of your new series.

      Select a date that will equal 100 for your custom index:
          Enter date as YYYY-MM-DD

      ADDLINE
      Type keywords to search for data
      Create user-defined line
      You can customize a graph by adding a straight line between two data points.
      FORMAT GRAPH
      Details
      Display
      Customize
      Frame
      Plot area
      Text

      Bar 1
      Market Yield on U.S. Treasury Securities at 3-Year Constant Maturity, Quoted on an Investment Basis Vintage: 2025-03-28
      Line details & color

      Line style, thickness, color and position


      Bar 2
      Market Yield on U.S. Treasury Securities at 3-Year Constant Maturity, Quoted on an Investment Basis Vintage: 2025-03-31
      Line details & color

      Line style, thickness, color and position


      Fullscreen

      Notes

      Title Release Dates

      2005-06-28 2014-04-01
      2014-04-02 2025-03-31
       
      Source    

      2005-06-28 2025-03-31
       
      Release    

      2005-06-28 2025-03-31
       
      Units    

      2005-06-28 2025-03-31
       
      Frequency    

      2005-06-28 2025-03-31
       
      Seasonal Adjustment    

      2005-06-28 2025-03-31
       
      Notes    

      2005-06-28 2014-04-01
      2014-04-02 2025-01-06
      2025-01-07 2025-03-31

      Related Data and Content

      Data Suggestions Based On Your Search

      Content Suggestions

      Other Formats

      Related Categories

      Releases

      Tags


      Color format