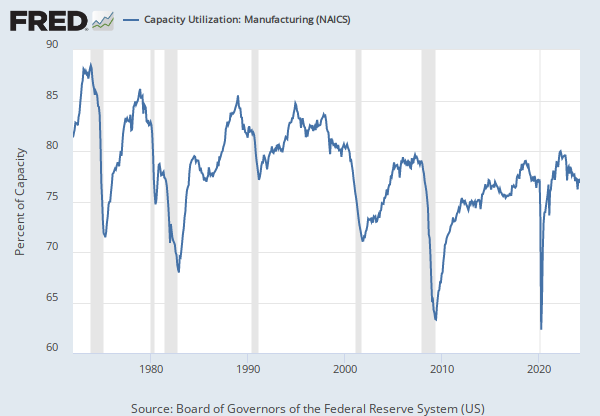
Capacity Utilization: Manufacturing: Durable Goods: Iron and Steel Products (NAICS = 3311,2) (CAPUTLG3311A2S)
1Y |
5Y |
10Y |
Max
Home > Releases > G.17 Industrial Production and Capacity Utilization > Capacity Utilization: Manufacturing: Durable Goods: Iron and Steel Products (NAICS = 3311,2)
Observation:
Feb 2021: 75.7749 (+ more)Feb 2021: | 75.7749 | |
Jan 2021: | 74.9040 | |
Dec 2020: | 73.1917 | |
Nov 2020: | 71.1815 | |
Oct 2020: | 67.0735 |
Units:
Percent of Capacity,Frequency:
MonthlyData in this graph are copyrighted. Please review the copyright information in the series notes before sharing.
Title | Release Dates | |
|
||
Capacity Utilization: Durable Manufacturing: Iron and steel products | 2015-02-18 | 2020-09-21 |
Capacity Utilization: Manufacturing: Durable Goods: Iron and Steel Products (NAICS = 3311,2) | 2020-09-22 | 2021-03-16 |
Source | ||
|
||
Board of Governors of the Federal Reserve System (US) | 2015-02-18 | 2021-03-16 |
Release | ||
|
||
G.17 Industrial Production and Capacity Utilization | 2015-02-18 | 2021-03-16 |
Units | ||
|
||
Percent of Capacity | 2015-02-18 | 2021-03-16 |
Frequency | ||
|
||
Monthly | 2015-02-18 | 2021-03-16 |
Seasonal Adjustment | ||
|
||
Seasonally Adjusted | 2015-02-18 | 2021-03-16 |
Notes | ||
|
||
For a given industry, the capacity utilization rate is equal to an output index divided by a capacity index. The Federal Reserve Board's capacity indexes attempt to capture the concept of sustainable maximum output-the greatest level of output a plant can maintain within the framework of a realistic work schedule, after factoring in normal downtime and assuming sufficient availability of inputs to operate the capital in place. NAICS = 3311,2 Source Code: CAPUTL.G3311A2.S |
2015-02-18 | 2021-03-16 |
Are you sure you want to remove this series from the graph? This can not be undone.