Observations
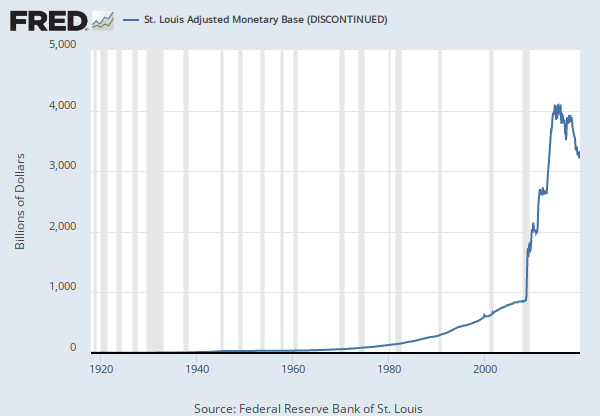
2019-12-18: 3,441.872 |
Billions of Dollars, Not Seasonally Adjusted |
Biweekly,
Ending Wednesday
Updated: Dec 19, 2019 3:31 PM CST
Observations
2019-12-18: | 3,441.872 | |
2019-12-04: | 3,340.500 | |
2019-11-20: | 3,311.727 | |
2019-11-06: | 3,282.965 | |
2019-10-23: | 3,235.853 |
Units:
Frequency:
Write a custom formula to transform one or more series or combine two or more series.
You can begin by adding a series to combine with your existing series.
Now create a custom formula to combine or transform the series.
Need help?
For example, invert an exchange rate by using formula 1/a, where “a” refers to the first FRED data series added to this line. Or calculate the spread between 2 interest rates, a and b, by using the formula a - b.
Use the assigned data series variables (a, b, c, etc.) together with operators (+, -, *, /, ^, etc.), parentheses and constants (1, 1.5, 2, etc.) to create your own formula (e.g., 1/a, a-b, (a+b)/2, (a/(a+b+c))*100). As noted above, you may add other data series to this line before entering a formula.
Finally, you can change the units of your new series.
Add the minimum, maximum, and average calculations of selected bars to the graph
Data in this graph are copyrighted. Please review the copyright information in the series notes before sharing.
Notes
Title | Release Dates | |
|
||
St. Louis Source Base | 2003-07-17 | 2019-11-28 |
St. Louis Source Base (DISCONTINUED) | 2019-11-29 | 2019-12-19 |
Source | ||
|
||
Federal Reserve Bank of St. Louis | 2003-07-17 | 2019-12-19 |
Release | ||
|
||
St. Louis Bi-Weekly Reserves and Monetary Base | 2003-07-17 | 2019-12-19 |
Units | ||
|
||
Billions of Dollars | 2003-07-17 | 2019-12-19 |
Frequency | ||
|
||
Biweekly, Ending Wednesday | 2003-07-17 | 2019-12-19 |
Seasonal Adjustment | ||
|
||
Not Seasonally Adjusted | 2003-07-17 | 2019-12-19 |
Notes | ||
|
||
This series has been reconstructed starting July 14, 2003. For further information, please refer to https://files.stlouisfed.org/research/publications/review/03/09/Anderson.pdf. Historical data and components are available at https://files.stlouisfed.org/research/publications/review/03/09/0309ra.xls.
|
2003-07-17 | 2019-11-28 |
Updates of this series will be ceased on December 19, 2019. Interested users can construct a proxy by summing Currency in circulation (H.4.1 release); Service Related Balances and Adjustments (H.4.1 release); and Reserve Balances with FR Banks (H.4.1 release). The discontinued series plotted on the same graph with the calculated data can be accessed for comparison here (https://fred.stlouisfed.org/graph/?g=oJ5N). For more details, see the FRED Announcement (https://news.research.stlouisfed.org/2019/12/discontinuance-of-st-louis-monetary-base-and-reserves-data/). |
2019-11-29 | 2019-12-19 |
Release Tables
Related Data and Content
Data Suggestions Based On Your Search
Content Suggestions
Other Formats
Related Categories
Releases
Tags
Permalink/Embed
modal open, choose link customization options
Select automatic updates to the data or a static time frame. All data are subject to revision.