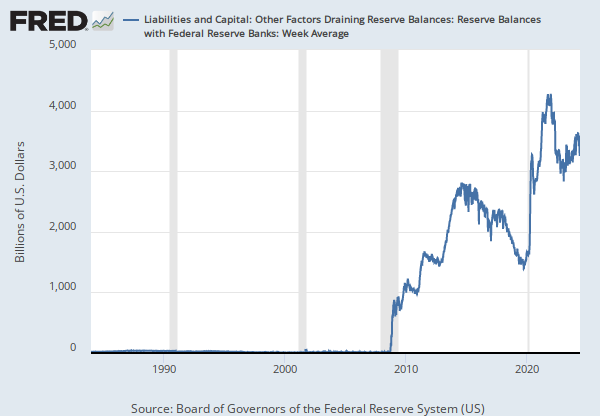
1Y |
5Y |
10Y |
Max
Home > Releases > St. Louis Monthly Reserves and Monetary Base > St. Louis Adjusted Reserves
Observation:
Oct 2019: 1,574.218 (+ more)Oct 2019: | 1,574.218 | |
Sep 2019: | 1,526.528 | |
Aug 2019: | 1,617.423 | |
Jul 2019: | 1,609.369 | |
Jun 2019: | 1,630.039 |
Units:
Billions of Dollars,Frequency:
MonthlyData in this graph are copyrighted. Please review the copyright information in the series notes before sharing.
Title | Release Dates | |
|
||
St. Louis Adjusted Reserves | 1997-02-14 | 2019-12-02 |
Source | ||
|
||
Federal Reserve Bank of St. Louis | 1997-02-14 | 2019-12-02 |
Release | ||
|
||
St. Louis Monthly Reserves and Monetary Base | 1997-02-14 | 2019-12-02 |
Units | ||
|
||
Billions of Dollars | 1997-02-14 | 2019-12-02 |
Frequency | ||
|
||
Monthly | 1997-02-14 | 2019-12-02 |
Seasonal Adjustment | ||
|
||
Not Seasonally Adjusted | 1997-02-14 | 2019-12-02 |
Notes | ||
|
||
This series has been reconstructed starting July 14, 2003. For further information, please refer to https://files.stlouisfed.org/research/publications/review/03/09/Anderson.pdf. Historical data and components are available at https://files.stlouisfed.org/research/publications/review/03/09/0309ra.xls. Further information and definitions are available at: http://research.stlouisfed.org/publications/mt/. |
1997-02-14 | 2019-12-01 |
Updates of this series will be ceased on December 20, 2019. Interested users can construct a proxy of the difference between monetary base from the H.3 release and currency component of M1 from the H.6 release. The discontinued series plotted on the same graph with the calculated data can be accessed for comparison here (https://fred.stlouisfed.org/graph/?g=oJ6h).
|
2019-12-02 | 2019-12-02 |
Are you sure you want to remove this series from the graph? This can not be undone.