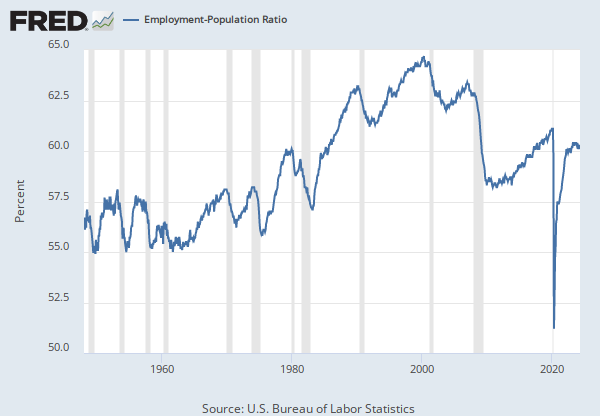
Observation:
Dec 2016: 59.7 (+ more) Updated: Jan 6, 2017Dec 2016: | 59.7 | |
Nov 2016: | 59.7 | |
Oct 2016: | 59.7 | |
Sep 2016: | 59.8 | |
Aug 2016: | 59.7 |
Units:
Percent,Frequency:
MonthlyData in this graph are copyrighted. Please review the copyright information in the series notes before sharing.
Title | Release Dates | |
|
||
Civilian Employment-Population Ratio | 1996-12-06 | 2019-09-05 |
Employment-Population Ratio | 2019-09-06 | 2023-05-05 |
Source | ||
|
||
U.S. Bureau of Labor Statistics | 1996-12-06 | 2023-05-05 |
Release | ||
|
||
Employment Situation | 1996-12-06 | 2023-05-05 |
Units | ||
|
||
Percent | 1996-12-06 | 2023-05-05 |
Frequency | ||
|
||
Monthly | 1996-12-06 | 2023-05-05 |
Seasonal Adjustment | ||
|
||
Seasonally Adjusted | 1996-12-06 | 2023-05-05 |
Notes | ||
|
||
The series comes from the 'Current Population Survey (Household Survey)' The source code is: LNS12300000 |
1996-12-06 | 2023-05-05 |