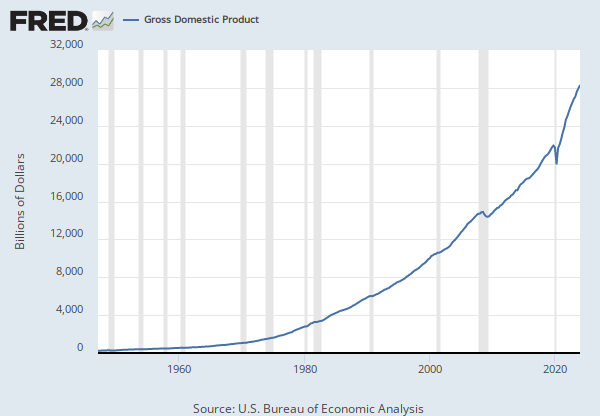
ALFRED Graph (GDPMC1)
Observation:
Q2 2014: 15,985,733 (+ more)Updated: Jul 30, 2014
Q2 2014: | 15,985,733 | |
Q1 2014: | 15,831,652 | |
Q4 2013: | 15,916,208 | |
Q3 2013: | 15,779,938 | |
Q2 2013: | 15,606,591 |
Units:
Millions of Chained 2009 Dollars,Seasonally Adjusted Annual Rate
Frequency:
QuarterlyReal Gross Domestic Product
Customize data:
Write a custom formula to transform one or more series or combine two or more series.
You can begin by adding a series to combine with your existing series.
Now create a custom formula to combine or transform the series.
Need help? []
For example, invert an exchange rate by using formula 1/a, where “a” refers to the first FRED data series added to this line. Or calculate the spread between 2 interest rates, a and b, by using the formula a - b.
Use the assigned data series variables (a, b, c, etc.) together with operators (+, -, *, /, ^, etc.), parentheses {(,)}, and constants (1, 1.5, 2, etc.) to create your own formula (e.g., 1/a, a-b, (a+b)/2, (a/(a+b+c))*100). As noted above, you may add other data series to this line before entering a formula.
Finally, you can change the units of your new series.
Real Gross Domestic Product
Customize data:
Write a custom formula to transform one or more series or combine two or more series.
You can begin by adding a series to combine with your existing series.
Now create a custom formula to combine or transform the series.
Need help? []
For example, invert an exchange rate by using formula 1/a, where “a” refers to the first FRED data series added to this line. Or calculate the spread between 2 interest rates, a and b, by using the formula a - b.
Use the assigned data series variables (a, b, c, etc.) together with operators (+, -, *, /, ^, etc.), parentheses {(,)}, and constants (1, 1.5, 2, etc.) to create your own formula (e.g., 1/a, a-b, (a+b)/2, (a/(a+b+c))*100). As noted above, you may add other data series to this line before entering a formula.
Finally, you can change the units of your new series.
Add data series to graph:
Data in this graph are copyrighted. Please review the copyright information in the series notes before sharing.
Title | Release Dates | |
|
||
Real Gross Domestic Product | 2012-12-20 | 2017-09-27 |
Real Gross Domestic Product (DISCONTINUED) | 2017-09-28 | 2017-09-28 |
Source | ||
|
||
U.S. Bureau of Economic Analysis | 2012-12-20 | 2017-09-28 |
Release | ||
|
||
Gross Domestic Product | 2012-12-20 | 2017-09-28 |
Units | ||
|
||
Millions of Chained 2005 Dollars | 2012-12-20 | 2013-07-30 |
Millions of Chained 2009 Dollars | 2013-07-31 | 2017-09-28 |
Frequency | ||
|
||
Quarterly | 2012-12-20 | 2017-09-28 |
Seasonal Adjustment | ||
|
||
Seasonally Adjusted Annual Rate | 2012-12-20 | 2017-09-28 |
Notes | ||
|
||
Cautionary note on the use of data in millions of dollars -- The tables provided include estimates in millions of dollars for NIPA series that appear regularly in the national income and product account (NIPA) tables published in the Survey of Current Business. The Bureau of Economic Analysis (BEA) generally does not include estimates at this level of precision in the published tables because the associated sampling and nonsampling errors are larger than this implied level of precision. Compared with the published aggregates, the million-dollar estimates are generally not any more accurate.
|
2012-12-20 | 2017-09-27 |
This series has been discontinued and will no longer be updated. It was a duplicate of the following series, which will continue to be updated: https://fred.stlouisfed.org/series/GDPC1 Cautionary note on the use of data in millions of dollars -- The tables provided include estimates in millions of dollars for NIPA series that appear regularly in the national income and product account (NIPA) tables published in the Survey of Current Business. The Bureau of Economic Analysis (BEA) generally does not include estimates at this level of precision in the published tables because the associated sampling and nonsampling errors are larger than this implied level of precision. Compared with the published aggregates, the million-dollar estimates are generally not any more accurate." |
2017-09-28 | 2017-09-28 |
Related Resources
Other Formats
Related Categories
Sources
Releases
Tags
Confirm Delete
Are you sure you want to remove this series from the graph? This can not be undone.