
NOTES
| Title | Release Dates | |
|
|
||
| Capacity Utilization: Total Industry | 1996-11-15 | 2020-09-21 |
| Capacity Utilization: Total Index | 2020-09-22 | 2024-05-16 |
| Source | ||
|
|
||
| Board of Governors of the Federal Reserve System (US) | 1996-11-15 | 2024-05-16 |
| Release | ||
|
|
||
| G.17 Industrial Production and Capacity Utilization | 1996-11-15 | 2024-05-16 |
| Units | ||
|
|
||
| Percent of Capacity | 1996-11-15 | 2024-05-16 |
| Frequency | ||
|
|
||
| Monthly | 1996-11-15 | 2024-05-16 |
| Seasonal Adjustment | ||
|
|
||
| Seasonally Adjusted | 1996-11-15 | 2024-05-16 |
| Notes | ||
|
|
||
|
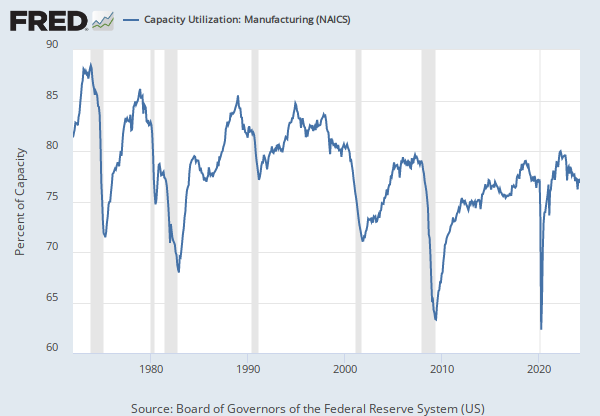
Capacity Utilization: Total Industry (TCU) is the percentage of resources used by corporations and factories to produce goods in manufacturing, mining, and electric and gas utilities for all facilities located in the United States (excluding those in U.S. territories).(1) We can also think of capacity utilization as how much capacity is being used from the total available capacity to produce demanded finished products. Capacity utilization indexes are constructed for 71 industries in manufacturing, 16 in mining, and 2 in utilities. (1) Physical data on capacity utilization are primarily compiled from trade sources and government sources, such as the U.S. Geological Survey and the U.S. Energy Information Administration.(1) When physical data are unavailable, capacity utilization data are compiled from the U.S. Census Bureau’s Quarterly Survey of Plant Capacity Utilization, which provides data for almost 70 percent of total industry capacity.(1) Additionally, the capacity index is developed on a monthly basis, designed to be consistent with the production index.(1) According to the Board of Governors of the Federal Reserve System, the capacity index tries to conceptualize the idea of sustainable maximum output, which is defined as the highest level of output a plant can sustain within the confines of its resources. The Board of Governors defines the seasonally adjusted capacity utilization rate as the output index divided by the capacity index. The capacity utilization rate can also implicitly describe how efficiently the factors of production (inputs in the production process) are being used. (1) It sheds light on how much more firms can produce without additional costs. Additionally, this rate gives manufacturers some idea as to how much consumer demand they will be able to meet in the future. The Federal Reserve strives to construct a capacity index consistent with time by using different relevant data sources.(1) Developing an index that is reasonable given the time period is the primary aim for this index, but there are still some difficulties. Extensive technological and structural changes have and will continue to occur, affecting the degree of tightness the Federal Reserve index of capacity utilization will represent.(2) In addition, each series of capacity utilization is flawed by commission; therefore, they should be used with caution.(2) References (1) Board of Governors of the Federal Reserve System. “Industrial Production and Capacity Utilization.” Statistical release G.17;. May 15, 2013. (2) Bauer, Paul W. and Deily, Mary E. “A User’s Guide to Capacity- Utilization Measures.” Economic Commentary. Federal Reserve Bank of Cleveland, July 1, 1988; https://www.clevelandfed.org/newsroom-and-events/publications/economic-commentary/economic-commentary-archives/1988-economic-commentaries/ec-19880701-a-users-guide-to-capacity-utilization-measures.aspx. |
1996-11-15 | 2020-09-21 |
|
For a given industry, the capacity utilization rate is equal to an output index divided by a capacity index. The Federal Reserve Board's capacity indexes attempt to capture the concept of sustainable maximum output-the greatest level of output a plant can maintain within the framework of a realistic work schedule, after factoring in normal downtime and assuming sufficient availability of inputs to operate the capital in place. For more information, see the explanatory notes (https://www.federalreserve.gov/releases/g17/About.htm) issued by the Board of Governors. For recent updates, see the announcements (https://www.federalreserve.gov/feeds/g17.html) issued by the Board of Governors Source Code: CAPUTL.B50001.S |
2020-09-22 | 2024-05-16 |
RELEASE TABLES
G.17 Industrial Production and Capacity Utilization
RELATED DATA AND CONTENT
Data Suggestions Based On Your Search


Content Suggestions

