
NOTES
| Title | Release Dates | |
|
|
||
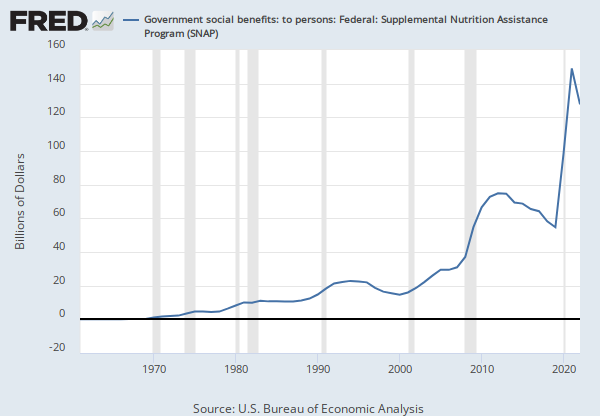
| State and Local Government Defined Benefit Pension Plans: Cash flow | 2016-06-28 | 2023-10-26 |
| Source | ||
|
|
||
| U.S. Bureau of Economic Analysis | 2016-06-28 | 2023-10-26 |
| Release | ||
|
|
||
| Gross Domestic Product | 2016-06-28 | 2023-10-26 |
| Units | ||
|
|
||
| Billions of Dollars | 2016-06-28 | 2023-10-26 |
| Frequency | ||
|
|
||
| Annual | 2016-06-28 | 2023-10-26 |
| Seasonal Adjustment | ||
|
|
||
| Not Seasonally Adjusted | 2016-06-28 | 2023-10-26 |
| Notes | ||
|
|
||
|
BEA Account Code: Y323RC1 A Guide to the National Income and Product Accounts of the United States (NIPA) - (http://www.bea.gov/national/pdf/nipaguid.pdf) |
2016-06-28 | 2017-10-26 |
|
BEA Account Code: Y323RC A Guide to the National Income and Product Accounts of the United States (NIPA) - (http://www.bea.gov/national/pdf/nipaguid.pdf) |
2017-10-27 | 2023-10-26 |
RELATED DATA AND CONTENT
Data Suggestions Based On Your Search


Content Suggestions


Related Categories
Gov't Social Benefits
Gov't Receipts, Expenditures & Investment
National Income & Product Accounts
National Accounts