
NOTES
| Title | Release Dates | |
|
|
||
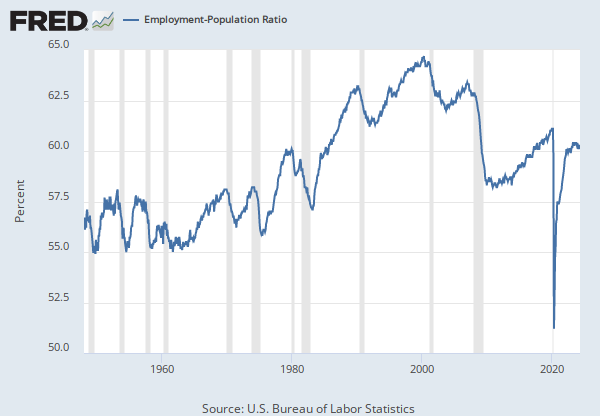
| Civilian Employment-Population Ratio | 1996-12-06 | 2019-09-05 |
| Employment-Population Ratio | 2019-09-06 | 2024-04-05 |
| Source | ||
|
|
||
| U.S. Bureau of Labor Statistics | 1996-12-06 | 2024-04-05 |
| Release | ||
|
|
||
| Employment Situation | 1996-12-06 | 2024-04-05 |
| Units | ||
|
|
||
| Percent | 1996-12-06 | 2024-04-05 |
| Frequency | ||
|
|
||
| Monthly | 1996-12-06 | 2024-04-05 |
| Seasonal Adjustment | ||
|
|
||
| Seasonally Adjusted | 1996-12-06 | 2024-04-05 |
| Notes | ||
|
|
||
|
The series comes from the 'Current Population Survey (Household Survey)' The source code is: LNS12300000 |
1996-12-06 | 2024-04-05 |
RELEASE TABLES
RELATED DATA AND CONTENT
Data Suggestions Based On Your Search


Content Suggestions


Related Categories
Employment Population Ratio
Current Population Survey (Household Survey)
Population, Employment, & Labor Markets