
NOTES
| Title | Release Dates | |
|
|
||
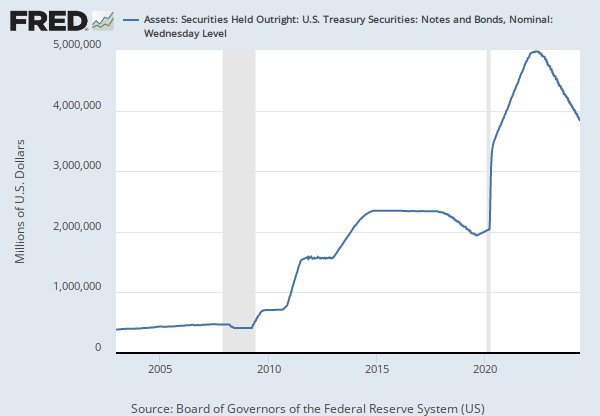
| Factors Supplying Reserve Balances: Securities Held Outright: U.S. Treasury Securities: Notes and Bonds, Inflation-Indexed | 2011-07-07 | 2019-08-20 |
| Assets: Securities Held Outright: U.S. Treasury Securities: Notes and Bonds, Inflation-Indexed: Week Average | 2019-08-21 | 2024-04-18 |
| Source | ||
|
|
||
| Board of Governors of the Federal Reserve System (US) | 2011-07-07 | 2024-04-18 |
| Release | ||
|
|
||
| H.4.1 Factors Affecting Reserve Balances | 2011-07-07 | 2024-04-18 |
| Units | ||
|
|
||
| Millions of Dollars | 2011-07-07 | 2019-08-20 |
| Millions of U.S. Dollars | 2019-08-21 | 2024-04-18 |
| Frequency | ||
|
|
||
| Weekly, Ending Wednesday | 2011-07-07 | 2024-04-18 |
| Seasonal Adjustment | ||
|
|
||
| Not Seasonally Adjusted | 2011-07-07 | 2024-04-18 |
| Notes | ||
|
|
||
|
The current face value of the Federal Reserve's outright holdings of inflation-indexed Treasury notes and bonds.
|
2011-07-07 | 2024-04-18 |
RELEASE TABLES
H.4.1 Factors Affecting Reserve Balances
RELATED DATA AND CONTENT
Data Suggestions Based On Your Search


Content Suggestions

