NOTES
| Title | Release Dates | |
|
|
||
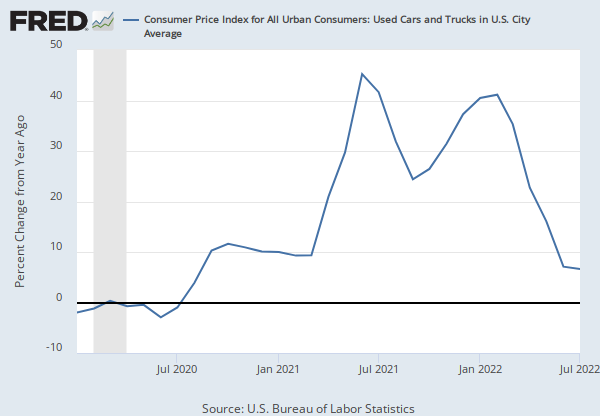
| Consumer Price Index for All Urban Consumers: Used cars and trucks | 2011-04-15 | 2019-09-11 |
| Consumer Price Index for All Urban Consumers: Used Cars and Trucks in U.S. City Average | 2019-09-12 | 2024-04-10 |
| Source | ||
|
|
||
| U.S. Bureau of Labor Statistics | 2011-04-15 | 2024-04-10 |
| Release | ||
|
|
||
| Consumer Price Index | 2011-04-15 | 2024-04-10 |
| Units | ||
|
|
||
| Index 1982-1984=100 | 2011-04-15 | 2024-04-10 |
| Frequency | ||
|
|
||
| Monthly | 2011-04-15 | 2024-04-10 |
| Seasonal Adjustment | ||
|
|
||
| Seasonally Adjusted | 2011-04-15 | 2024-04-10 |
RELEASE TABLES
Consumer Price Index
RELATED DATA AND CONTENT
Data Suggestions Based On Your Search


Content Suggestions