
NOTES
| Title | Release Dates | |
|
|
||
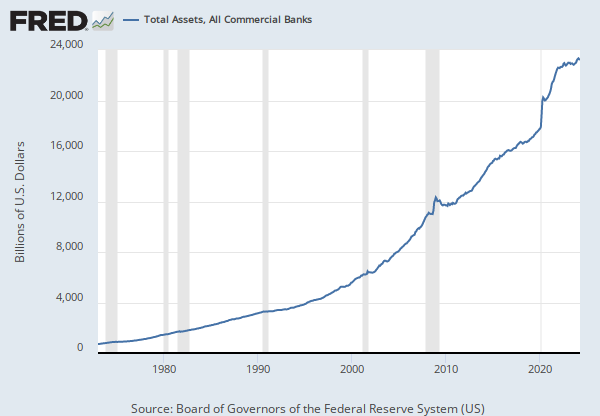
| Bank Credit at All Commercial Banks | 1996-12-13 | 2019-08-08 |
| Bank Credit, All Commercial Banks | 2019-08-09 | 2024-04-19 |
| Source | ||
|
|
||
| Board of Governors of the Federal Reserve System (US) | 1996-12-13 | 2024-04-19 |
| Release | ||
|
|
||
| H.8 Assets and Liabilities of Commercial Banks in the United States | 1996-12-13 | 2024-04-19 |
| Units | ||
|
|
||
| Billions of U.S. Dollars | 1996-12-13 | 2024-04-19 |
| Frequency | ||
|
|
||
| Monthly | 1996-12-13 | 2024-04-19 |
| Seasonal Adjustment | ||
|
|
||
| Seasonally Adjusted | 1996-12-13 | 2024-04-19 |
| Notes | ||
|
|
||
|
For further information, please refer to the Board of Governors of the Federal Reserve System's H.8 release, online at http://www.federalreserve.gov/releases/h8/.
|
1996-12-13 | 2024-04-19 |
RELEASE TABLES
H.8 Assets and Liabilities of Commercial Banks in the United States
RELATED DATA AND CONTENT
Data Suggestions Based On Your Search


Content Suggestions

