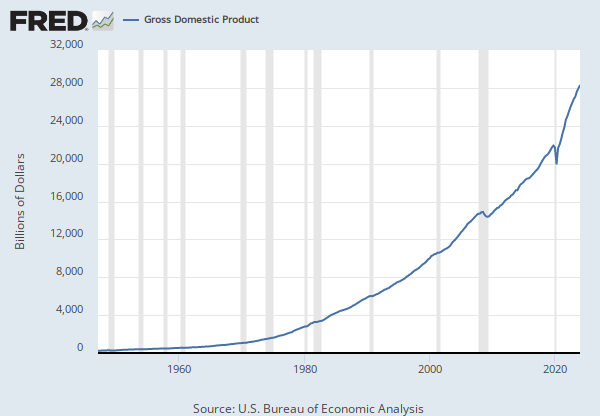
|
Title
|
Release Dates
|
|
|
Real Gross Domestic Product
|
2012-12-20
|
2017-07-27
|
|
Real Gross Domestic Product (DISCONTINUED)
|
2017-07-28
|
2017-07-28
|
|
|
|
Source
|
|
|
|
|
U.S. Bureau of Economic Analysis
|
2012-12-20
|
2017-07-28
|
|
|
|
Release
|
|
|
|
|
Gross Domestic Product
|
2012-12-20
|
2017-07-28
|
|
|
|
Units
|
|
|
|
|
Millions of Chained 2005 Dollars
|
2012-12-20
|
2013-07-30
|
|
Millions of Chained 2009 Dollars
|
2013-07-31
|
2017-07-28
|
|
|
|
Frequency
|
|
|
|
|
Annual
|
2012-12-20
|
2017-07-28
|
|
|
|
Seasonal Adjustment
|
|
|
|
|
Not Seasonally Adjusted
|
2012-12-20
|
2017-07-28
|
|
|
|
Notes
|
|
|
|
Cautionary note on the use of data in millions of dollars -- The tables provided include estimates in millions of dollars for NIPA series that appear regularly in the national income and product account (NIPA) tables published in the Survey of Current Business. The Bureau of Economic Analysis (BEA) generally does not include estimates at this level of precision in the published tables because the associated sampling and nonsampling errors are larger than this implied level of precision. Compared with the published aggregates, the million-dollar estimates are generally not any more accurate.
|
2012-12-20
|
2017-07-27
|
This series has been discontinued and will no longer be updated. It was a duplicate of the following series, which will continue to be updated: https://fred.stlouisfed.org/series/GDPCA
Cautionary note on the use of data in millions of dollars -- The tables provided include estimates in millions of dollars for NIPA series that appear regularly in the national income and product account (NIPA) tables published in the Survey of Current Business. The Bureau of Economic Analysis (BEA) generally does not include estimates at this level of precision in the published tables because the associated sampling and nonsampling errors are larger than this implied level of precision. Compared with the published aggregates, the million-dollar estimates are generally not any more accurate.
|
2017-07-28
|
2017-07-28
|


