
NOTES
| Title | Release Dates | |
|
|
||
| Commercial and Industrial Loans, All Commercial Banks | 1996-12-13 | 2024-04-19 |
| Source | ||
|
|
||
| Board of Governors of the Federal Reserve System (US) | 1996-12-13 | 2024-04-19 |
| Release | ||
|
|
||
| H.8 Assets and Liabilities of Commercial Banks in the United States | 1996-12-13 | 2024-04-19 |
| Units | ||
|
|
||
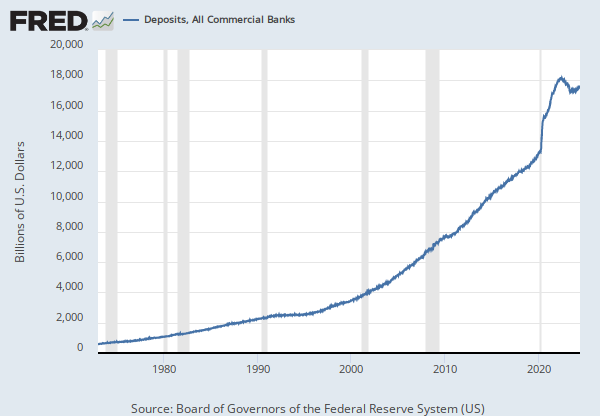
| Billions of U.S. Dollars | 1996-12-13 | 2024-04-19 |
| Frequency | ||
|
|
||
| Monthly | 1996-12-13 | 2024-04-19 |
| Seasonal Adjustment | ||
|
|
||
| Seasonally Adjusted | 1996-12-13 | 2024-04-19 |
| Notes | ||
|
|
||
|
For further information, please refer to the Board of Governors of the Federal Reserve System's H.8 release, online at http://www.federalreserve.gov/releases/h8/.
|
1996-12-13 | 2019-06-27 |
|
For further information, please refer to the Board of Governors of the Federal Reserve System's H8 release (http://www.federalreserve.gov/releases/h8/).
|
2019-06-28 | 2024-04-19 |
RELEASE TABLES
H.8 Assets and Liabilities of Commercial Banks in the United States
RELATED DATA AND CONTENT
Data Suggestions Based On Your Search


Content Suggestions


Other Formats
Monthly, Not Seasonally Adjusted
Weekly, Not Seasonally Adjusted
Weekly, Seasonally Adjusted
Millions of Dollars, Quarterly, Not Seasonally Adjusted
Percent Change at Annual Rate, Quarterly, Seasonally Adjusted