
NOTES
| Title | Release Dates | |
|
|
||
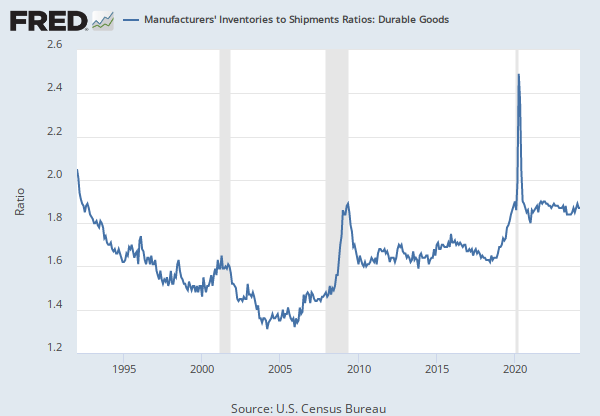
| Manufacturers' Total Inventories: Durable Goods | 2011-06-24 | 2024-04-02 |
| Source | ||
|
|
||
| U.S. Census Bureau | 2011-06-24 | 2024-04-02 |
| Release | ||
|
|
||
| Manufacturer's Shipments, Inventories, and Orders (M3) Survey | 2011-06-24 | 2024-04-02 |
| Units | ||
|
|
||
| Millions of Dollars | 2011-06-24 | 2024-04-02 |
| Frequency | ||
|
|
||
| Monthly, End of Period | 2011-06-24 | 2024-04-02 |
| Seasonal Adjustment | ||
|
|
||
| Seasonally Adjusted | 2011-06-24 | 2024-04-02 |
| Notes | ||
|
|
||
|
Estimates of Shipments for the semiconductor industry are no longer shown separately, but are included in Computers and Electronic Products industry and in all other applicable aggregate totals.
|
2011-06-24 | 2024-04-02 |
RELATED DATA AND CONTENT
Data Suggestions Based On Your Search


Content Suggestions

